If you use Google PageSpeed Insights to measure Web Vitals, you would have seen the Field Data and Origin Summary section.
 As you might already know, Field Data is the real-world data that is obtained via Chrome’s User Experience Report (CrUX). This data is collected from the users that have User Statistics Reporting enabled in their browser.
This is also the data that is actually used by Google in their Page Experience Algorithm update.
So, what is Origin Summary then?
Origin summary is actually a part of Field Data too. It is basically the aggregate of the Field Data of all the URLs on the website you have tested.
So, what’s the difference?
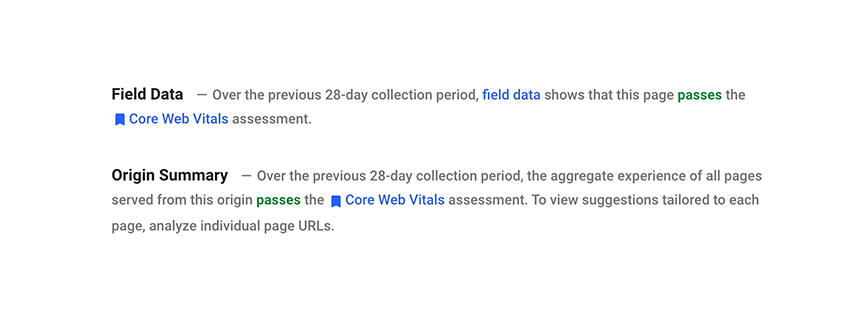
The Field Data section on PageSpeed Insights reports the “field data” of the URL that you have tested. While the Origin Summary section displays the aggregate field data of all the URLs on that particular website.
I feel PageSpeed Insight should instead use a simpler term to make it easy for everyone to understand the difference. Also, moving the Origin Summary within the Field Data instead of displaying it in a separate section would make more sense.
Field Data on SpeedVitals
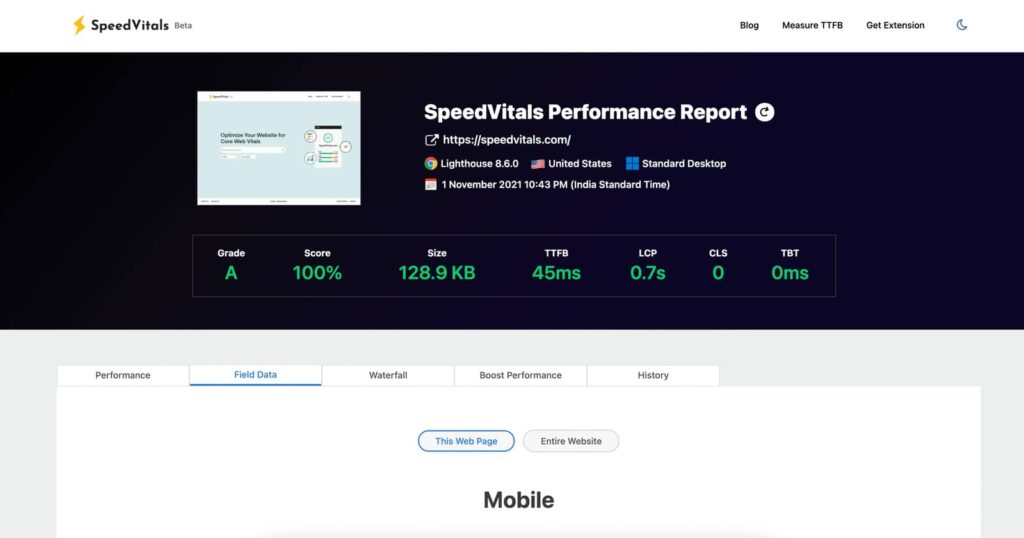
To avoid the same confusion, we have listed both the single page Field Data as well as the Origin Summary inside a single Tab.
When you test a site on SpeedVitals, you can select the Field Data Tab and here you will find two options to either view the Field Data of the current URL through the option This Web Page, or the origin summary using the option Entire Website.
So summing up, here’s what our data equivalent to PageSpeed Insights is called:
| Single-Page Field Data | Entire Website Field Data | |
| PageSpeed Insights | Field Data | Origin Summary |
| SpeedVitals | This Web Page | Entire Website |
We also have a slightly different design as compared to PageSpeed Insights.
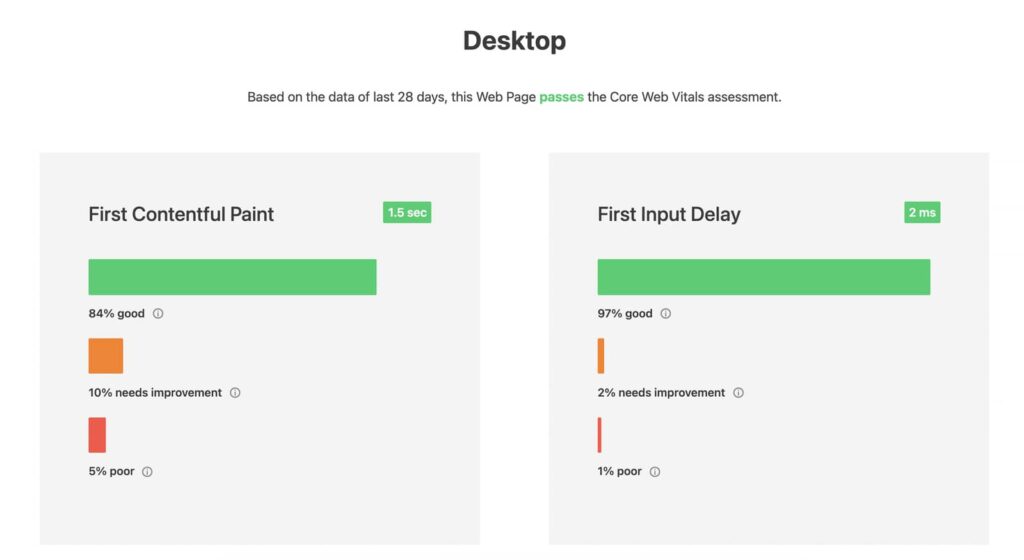
Instead of using a single bar to display all three data points, we use three separate ones for better readability.
Also, you can try hovering over the i (info) button to understand the criteria to fit in that particular category.
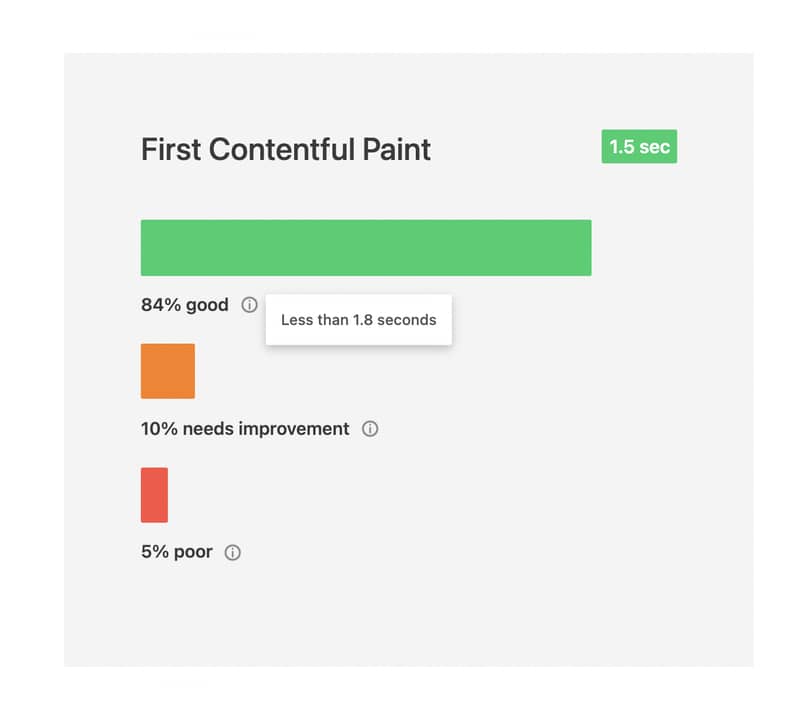
The above data can be interpreted as 84% percent of your website visits had a First Contentful Paint under 1.8 seconds. Since the good metric passes the 75th percentile criteria, it is said to pass the Web Vitals.
In the near future, we will be displaying even more useful insights in SpeedVitals’s Field Data section so that it can help you better understand and visualize your Website’s real-world Performance.
If you have any other questions with regards to field data, feel free to drop them below in the comments section.