
While our main Website SpeedVitals.com is custom-built, I decided to go with WordPress for our Blog. One of the main reasons for that was to demonstrate Speed Optimization techniques and create guides just like this one.
So today, I’ll be optimizing this Website live as I write this article. My goal is to score 100% on Web Vitals Test and have a worldwide TTFB under 100 ms.
Also, you should note that I’ll be achieving that using a Shared Hosting that costs just $1.33/month.
But before we begin, I want to clarify that this is a relatively new Website with less than 15 plugins. Optimizing an average WordPress site with more plugins will require more effort but it is still achievable within a couple of hours.
I’ll be writing more optimization tutorials in the near future that will tackle some of the slowest WordPress sites.
So without any further ado, let’s get started.
Website Configuration and Baseline Score
| Hosting | Hostomy Starter Plan ($1.33/month) |
| Hosting Type | Shared |
| Web Server | OpenLiteSpeed |
| Theme | GeneratePress |
| Page Builder | Beaver Builder |
| No. of Plugins | 14 |
| CDN | Cloudflare Free Plan |
Apart from the default Cloudflare Optimizations, I’ve no other Caching/Performance plugin installed as of now.
Instead of performing the tests on Home Page, it would make more sense to do it on the Post Page since this is a blog and the Home Page will get relatively fewer page views.
I’ve selected this page to perform the tests on this page, Digitalocean Premium AMD vs Intel.
I’ll be using our own Web Vitals Test on the Standard Mobile + United States Configuration. And for TTFB, I’ll again use our own tool that can measure TTFB from 25 locations in just one go.
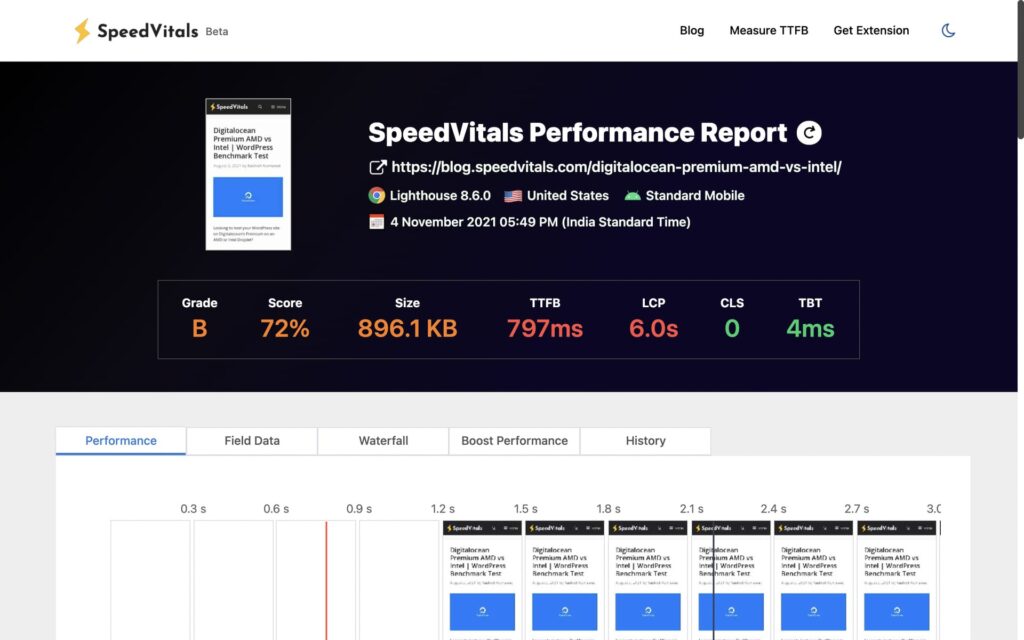
Here are the Baseline Performance Results.
Overall Score
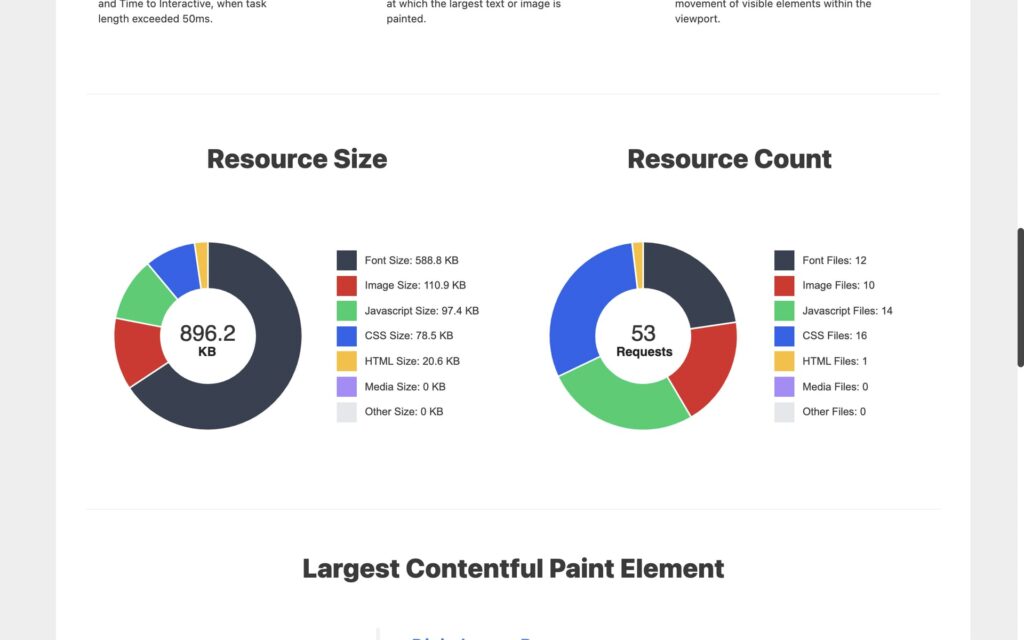
Resource Count
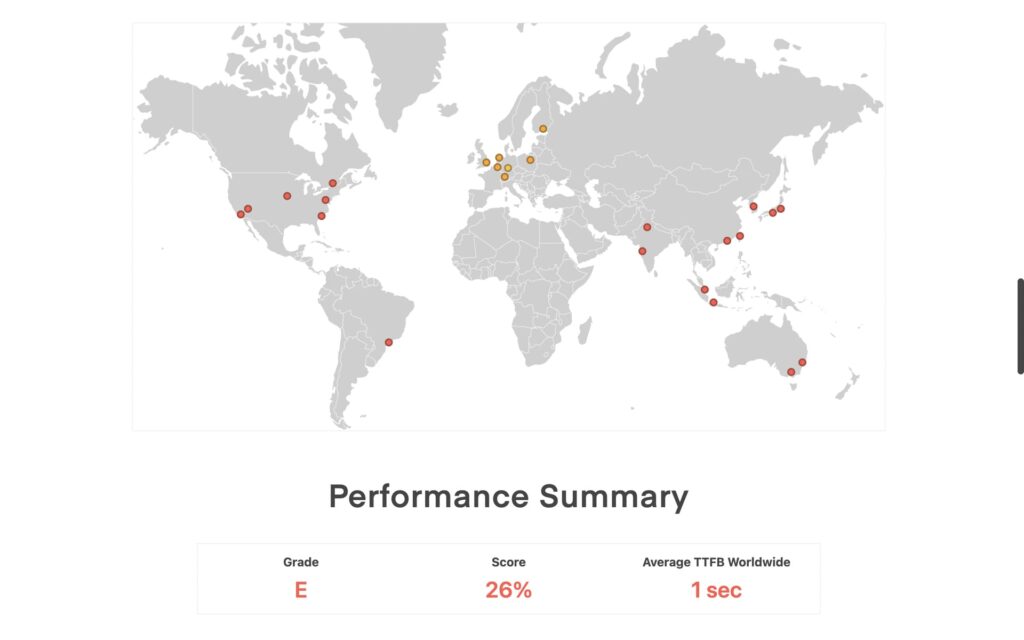
Global TTFB
As you can see, the performance isn’t too bad despite being on shared hosting.
It mostly has to do with the fact that the plugin count is low, I’m using a well-optimized theme (GeneratePress), and due to some of the basic optimizations applied by Cloudflare by default.
| Test Report | Report Link |
| Performance Score | 72% |
| Largest Contentful Paint | 6.0 sec |
| Cumulative Layout Shift | 0.00 |
| Total Blocking Time | 4 ms |
| First Contentful Paint | 2.2 sec |
| Speed Index | 3.8 sec |
| Time to Interactive | 5.7 sec |
| Page Size | 896.1 KB |
| Time to First Byte (TTFB) | 797 ms (Web Vitals Test), 1 sec (Global TTFB Test) |
Optimization Strategy
Based on analyzing the Waterfall Chart and the Performance Tips section, there won’t be much to do except tinkering with some of the optimization plugins.
I observed that there were 53 requests for this page. I’ll need to eliminate a lot of files. One of the main culprits is the “Social Icons Widget & Block by WPZOOM” Plugin that is injecting 10 Font files having a size of 537 KB in total. That’s nearly 2/3rd of the total Page Size. It is also injecting multiple CSS files that are unnecessary.
I’m using it to display just this small widget and it shouldn’t even consume 10 KB.
![]()
There seems no point in optimizing that and I’ll have to replace it either with another plugin or manually code it.
Here’s the strategy I prepared for optimizing our Blog:
- Getting Rid of Unoptimized Plugins (Social Icons by WPZOOM Plugin)
- Unload Unnecessary Files & Embeds (Perfmatters)
- Install Caching & Image Optimization Plugin (WP-Rocket & Imagify)
- Lazy-Load Images (WP-Rocket)
- Enable Link Preloading (WP-Rocket)
- Delay JavaScript and Load it on User Interaction (WP-Rocket)
- Self-Host Google Fonts (OMGF)
- Enable Cloudflare Full Page Caching
After performing every step, I’ll be performing the test to see the impact.
Getting Rid of Unoptimized Plugins
For this section, I just need to get rid of the Social Icons Plugin. Since it is an extremely simple thing to implement, it is better to write the custom code instead of switching to another plugin.
I picked four social media icons and created a CSS Sprite using this tool.
I wrote the code for my custom Social Media Icons on Codepen which you can check out here: Codepen
On WordPress, I created a custom HTML Widget where I pasted the HTML code from Codepen. I uploaded the CSS sprite Image in WordPress Media Library and added the Custom CSS by going to Appearance -> Customize -> Additional CSS.
I also changed the URL for the CSS Sprite Image to the one in my Media Library (in the background property of the Custom CSS).
Here’s the new social media widget looks like:
![]()
And it takes just 6 KB and not 537 KB!
I would work on improving its design later but for now, this should do.
Let’s perform the Web Vitals test again!
Results
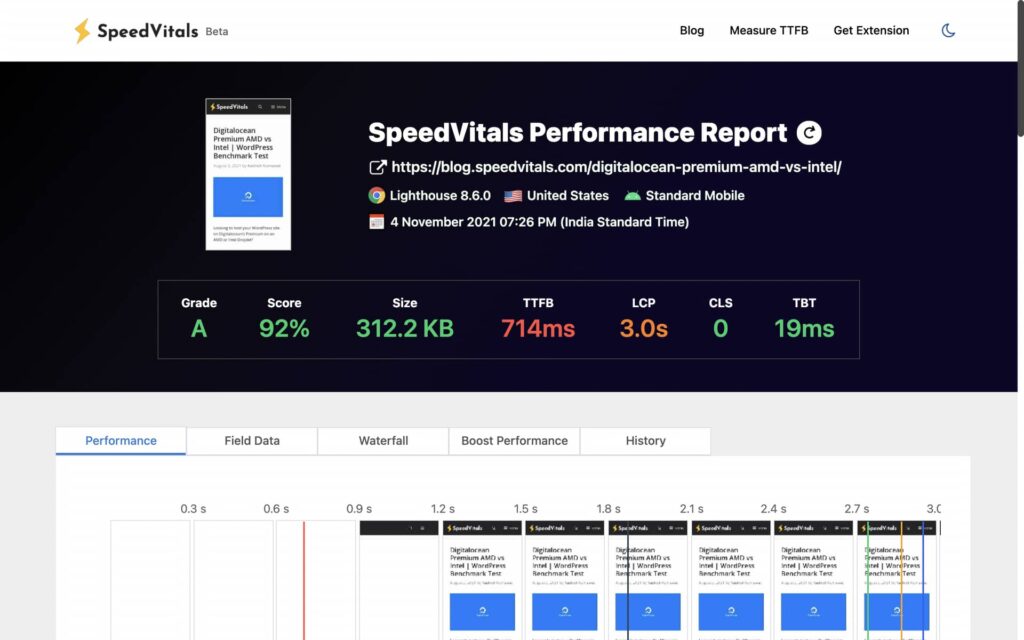
The scores really shouldn’t surprise you since that plugin was the biggest culprit behind the performance.
In just one step, we moved from a score of 72% to 92%.
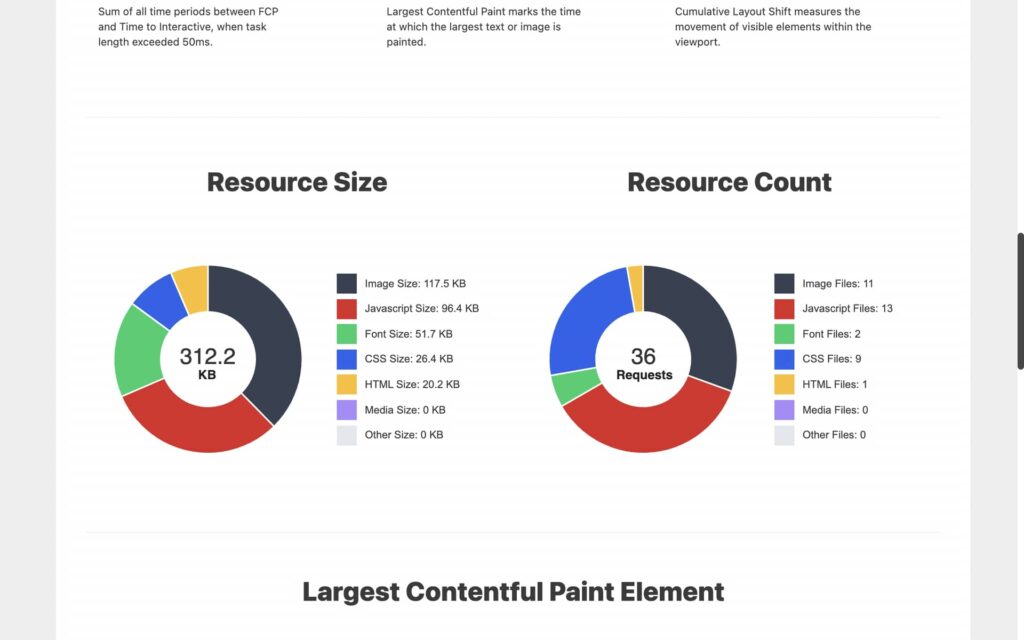
The resource size has decreased by more than half while the request count has dropped from 53 to just 36.
Here’s the list of all the scores along with the link to the Test Report.
| Test Report | Report Link |
| Performance Score | 92% (+27.8% Improvement) |
| Largest Contentful Paint | 3.0 sec (+100% Improvement) |
| Cumulative Layout Shift | 0.00 (+0% Change) |
| Total Blocking Time | 4 ms (+0% Change) |
| First Contentful Paint | 1.9 sec (+15.8% Improvement) |
| Speed Index | 2.8 sec (+35.7% Improvement) |
| Time to Interactive | 2.9 sec (+96.5% Improvement) |
| Page Size | 312.2 KB (+187% Improvement) |
| Time to First Byte (TTFB) | 714 ms (+11.6% Improvement) |
Unload Unnecessary Files & Embeds
I’ve installed the Perfmatters Plugin which is an excellent choice to unload assets that are not being used on the website.
I’m using the plugin with its default settings but I’ve also enabled the Google Analytics Optimization and I’m using the minimal version of Analytics. (Earlier, there was no Analytics Code on this site).
You’ll find an excellent guide to use Perfmatters in this article by Tom Dupuis.
Now it’s time to play with the Script Manager of the plugin.

After a lot of debugging, I ended up disabling the following for non-logged in Users:
- /wp-includes/css/admin-bar.min.css
- /wp-includes/css/admin-bar.min.js
- /wp-includes/css/dashicons.min.cs
- /wp-includes/js/hoverintent-js.min.js
- /wp-includes/js/jquery/jquery.min.js
Luckily, none of my Plugins were using JQuery so I was able to get rid of it. Make sure to check for any console errors while unloading assets.
If your website has a lot of plugins, it is very likely that some of those would be relying on JQuery. I’ll highly recommend switching to Vanilla JavaScript alternatives if they exist.
Results

While you wouldn’t see a huge performance improvement here due to low plugin count, many of the websites can see a massive improvement with the help of Perfmatters.
| Test Report | Report Link |
| Performance Score | 94% (+2.2% Improvement) |
| Largest Contentful Paint | 2.9 sec (+3.4% Improvement) |
| Cumulative Layout Shift | 0.00 (+0% Change) |
| Total Blocking Time | 0 ms (Reduced from 4 ms to 0 ms) |
| First Contentful Paint | 1.7 sec (+11.8% Improvement) |
| Speed Index | 2.5 sec (+12% Improvement) |
| Time to Interactive | 2.8 sec (+3.6% Improvement) |
| Page Size | 270 KB (+15.6% Improvement) |
| Time to First Byte (TTFB) | 700 ms (+2% Improvement) |
Installing Caching Plugin
In this step, we will be performing five tasks. The last three tasks are simply a part of the Plugin setup:
- Caching Plugin Setup
- Image Optimization Plugin Setup
- Lazy Loading Images
- Enable Link Preloading
- Delaying JavaScript
I’ve first installed WP-Rocket and it’s time to configure its settings.
In my WP-Rocket Settings, I have the following options enabled:
- Minify CSS Files
- Minify JavaScript Files
- Load JavaScript deferred
- Delay JavaScript Execution
- Lazyload Enabled for Images, iFrames, and Videos
- Add missing Image Dimensions
- Disabled WordPress Embeds
- Activate Preloading
- Enable Link Preloading
I’ve also enabled the Cloudflare add-on for WP-Rocket which will automatically clear the Cloudflare cache whenever I purge WP-Rocket Cache.
To boost the Page Speed further, I could have also enabled Optimize CSS Delivery and Remove Unused CSS but I felt that would be an overkill for this site and a score of 100% is achievable even without it. The same can be said about LCP Image Preloading but again that would be overkill.
Imagify Settings:
- Optimization Level Ultra
- Auto-Optimize images on upload
- Backup original images
- Keep all EXIF data from your images
- Create WebP versions of images
Results
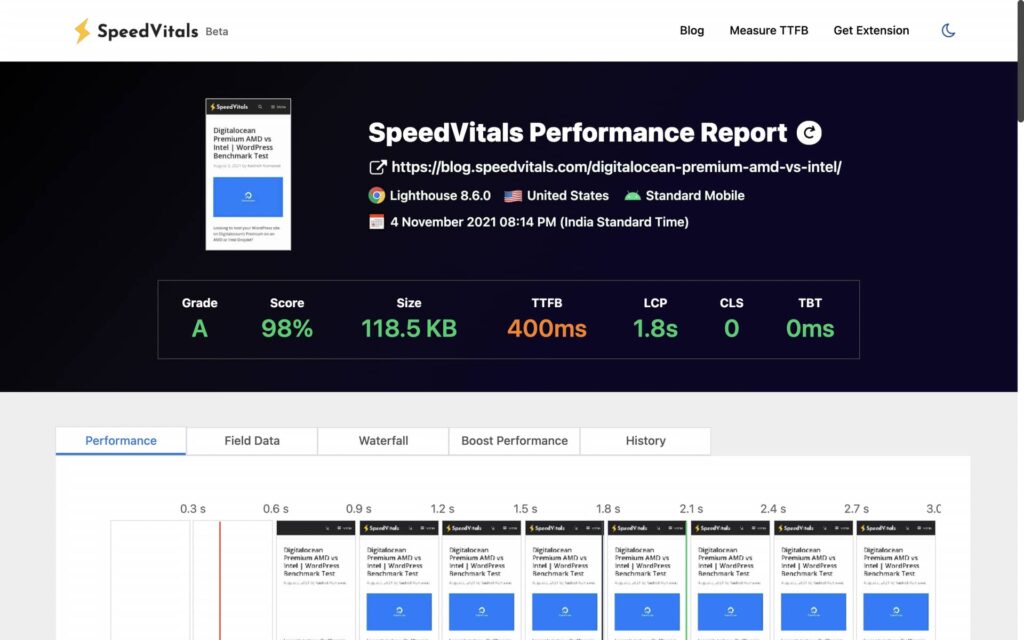
We just scored 98%! We are nearly there. This step has led to a huge improvement in Largest Contentful Paint, Time to Interactive, Page Size, and TTFB.
Most of the improvements are due to delaying javascript files until user interaction. I’ve written an entire article on the same and this could also be implemented on Custom websites with ease.
Delaying JavaScript files has also reduced the Page Size considerably.
| Test Report | Report Link |
| Performance Score | 98% (+4.3% Improvement) |
| Largest Contentful Paint | 1.8 sec (+61% Improvement) |
| Cumulative Layout Shift | 0.00 (+0% Change) |
| Total Blocking Time | 0 ms (+0% Change) |
| First Contentful Paint | 1.7 sec 1.8 sec (5.5% Decrease) |
| Speed Index | 2.1 sec (+19% Improvement) |
| Time to Interactive | 1.8 sec (+55.5% Improvement) |
| Page Size | 118.5 KB (+127.8% Improvement) |
| Time to First Byte (TTFB) | 400 ms (+75% Improvement) |
Self-Hosting Google Fonts
Before you think about whether it is really worth it, check out this article by Gijo Varghese.
I’ve installed the OMGF | Host Google Fonts Locally Plugin for this job. You can select not to load certain fonts that are not being used.
It is very easy to use and you’ll be surprised by the performance improvements.
Results
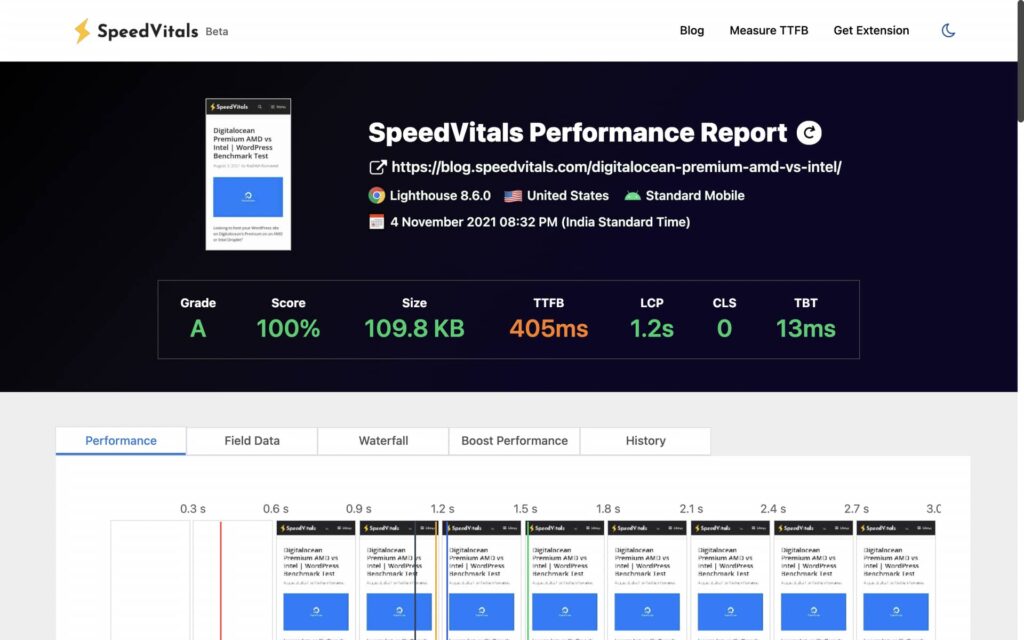
Yes, scored a 100% score this time!
We ended up increasing our FCP & LCP by 54.5% and 50% respectively just by hosting our Google Fonts locally and getting rid of the ones that we are not using.
The impact of Fonts and Icons on Web Performance is truly underrated.
| Test Report | Report Link |
| Performance Score | 100% (+2% Improvement) |
| Largest Contentful Paint | 1.2 sec (+50% Improvement) |
| Cumulative Layout Shift | 0.00 (+0% Change) |
| Total Blocking Time | 13 ms (Increase from 0 ms to 13 ms) |
| First Contentful Paint | 1.1 sec (+54.5% Improvement) |
| Speed Index | 1.6 sec (+31.3% Improvement) |
| Time to Interactive | 1.2 sec (+50% Improvement) |
| Page Size | 109.8 KB (+7.9% Improvement) |
| Time to First Byte (TTFB) | 405 ms (+1.25% increase) |
Enabling Cloudflare Full Page Caching
This is the last step that will Cache the HTML content of the WordPress at Cloudflare Edge Locations. This will dramatically reduce the TTFB throughout the globe. To learn more about reducing TTFB, check out this guide.
Here’s a complete guide for implementing Cloudflare HTML Caching. Alternatively, you can also use Cloudflare APO which costs $5/month.
Results
And here are the results of our Global TTFB Test.

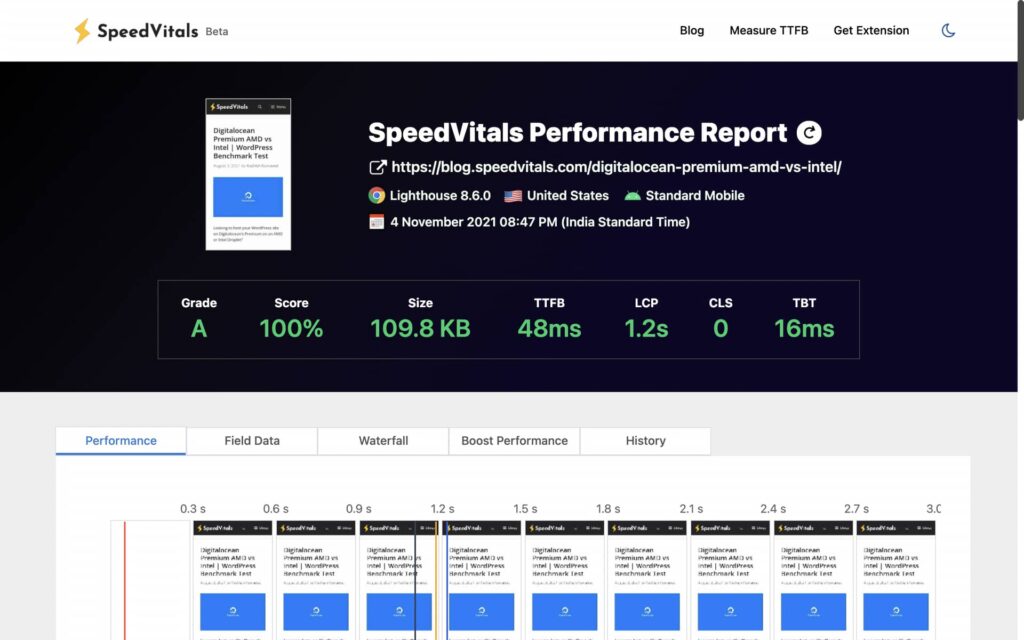
We scored a whopping 98% on the TTFB Test with a global average of 76 ms!
| Test Report | Report Link |
| Performance Score | 100% (+0% Change) |
| Largest Contentful Paint | 1.2 sec (+0% Change) |
| Cumulative Layout Shift | 0.00 (+0% Change) |
| Total Blocking Time | 16 ms (23% increase) |
| First Contentful Paint | 1.1 sec (+0% Change) |
| Speed Index | 1.1 sec (+45% Improvement) |
| Time to Interactive | 1.2 sec (+0% Change) |
| Page Size | 109.8 KB (+0% Change) |
| Time to First Byte (TTFB) | Web Vitals Test: 48 ms (+743% Improvement), Global TTFB Test: 76 ms (+1215% Improvement) |
Summing Up
This was the first speed optimization written by me on SpeedVitals’s Blog and I’ll continue to write more such guides in the near future.
Next time, I’ll definitely take on a site that scores extremely low on Web Vitals Test and will include CLS fixes as well.
If you would also like to see a guide for platforms other than WordPress, let me know.